Statistical Correlations in Blackjack Simulations: Linking True Counts to Optimal Betting Patterns
Online blackjack simulations have long served as testing grounds for card counting systems where researchers track how true count values align with recommended bet spreads across millions of hands. Data from these runs reveal correlation coefficients that measure the strength of relationships between rising true counts and the optimal amounts players should wager at each level. Analysts compile results from multi-deck games with standard rules to produce scatter plots and regression lines that quantify how closely actual optimal spreads match theoretical predictions.
Defining Key Variables in Simulation Models
True count calculations divide the running count by the number of decks remaining and this value drives decisions on when to increase bets. Optimal bet spreads emerge from expected value calculations that factor in player advantage at each true count level while accounting for variance and risk of ruin. Simulation software runs thousands of sessions under controlled parameters such as six-deck shoes with 75 percent penetration and dealer hits on soft seventeen to generate datasets for correlation analysis.
Researchers apply Pearson and Spearman methods to these datasets because the former measures linear relationships while the latter handles any monotonic patterns that appear in non-linear betting curves. Output tables list coefficients ranging from 0.75 to 0.92 depending on the counting system in use and the specific ruleset modeled. Higher coefficients appear when simulations restrict play to high-count situations only whereas broader count ranges tend to lower the measured correlation.
Simulation Parameters and Data Collection Practices
Teams running these studies standardize deck composition, shuffle frequency, and player strategy deviations to isolate the effect of true count on bet sizing. Each simulation logs the true count at the start of every round along with the bet size chosen by an algorithm that maximizes growth rate subject to a fixed bankroll. Aggregated results feed into correlation matrices that also incorporate secondary variables such as remaining deck penetration and recent outcome streaks.
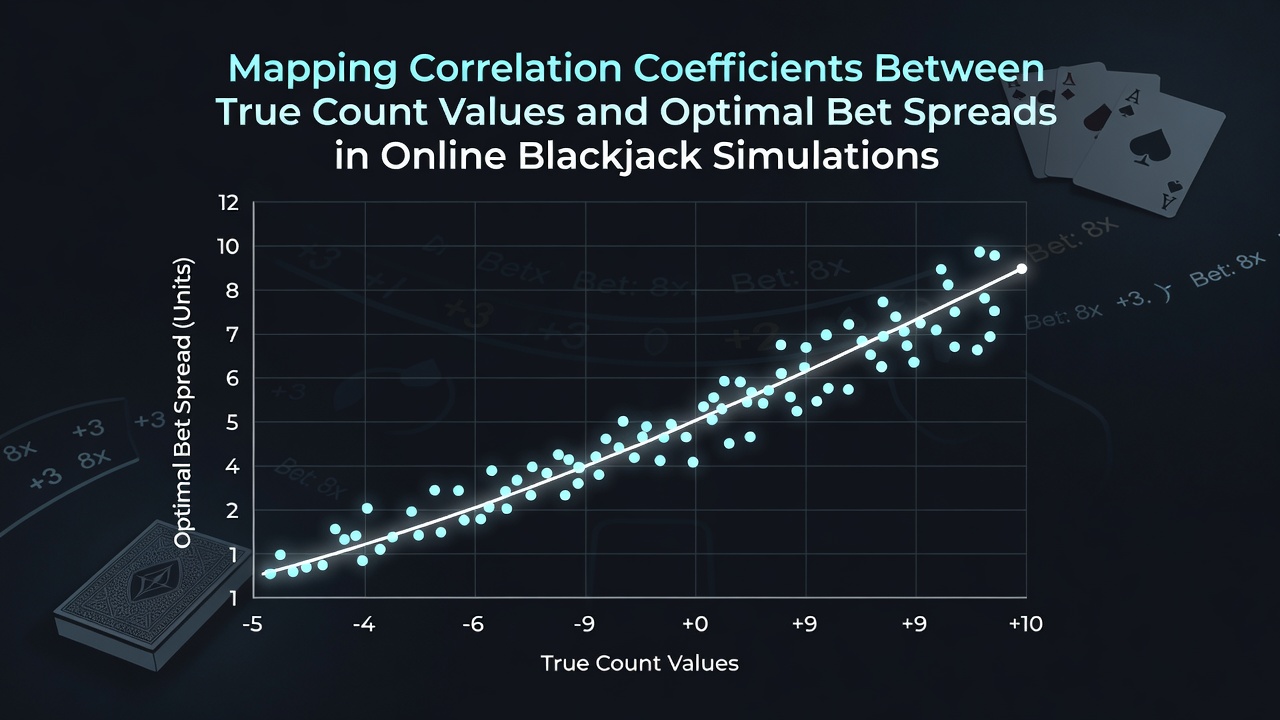
One dataset compiled in early 2026 incorporated over 50 million hands across 200 distinct rule variations and produced coefficient maps that highlight clusters where true counts between +2 and +5 show the tightest alignment with optimal spreads. Outside those ranges the relationship weakens because minimum bet floors and table maximums constrain the spread ratios that algorithms would otherwise recommend.
Interpreting Coefficient Values Across Different Counting Systems
Hi-Lo counting systems typically yield correlation coefficients around 0.85 when paired with a 1-12 bet spread in six-deck games. More advanced counts such as Halves or Zen produce slightly higher values near 0.89 because they capture additional card removal effects that refine the true count precision. Simulation output shows these differences most clearly in late-shoe situations where deck composition deviates sharply from the initial state.

Platforms hosting the simulations allow users to adjust parameters in real time and export raw data for further statistical processing. June 2026 updates to several major simulation packages introduced faster Monte Carlo engines that cut computation time by 40 percent while maintaining the same level of precision in coefficient estimates. Observers note that these improvements have encouraged more frequent recalibration of betting curves based on fresh correlation data.
Regional Variations in Simulation Standards
European operators often model games with continuous shuffle machines that reset penetration patterns and thereby alter the distribution of true count values encountered during play. Australian regulatory reports from state gaming authorities document similar adjustments when operators introduce automatic shufflers on multi-deck tables. Correlation coefficients in those environments tend to cluster lower because frequent reshuffles reduce the occurrence of extreme counts that drive the largest bet spreads.
North American simulation studies frequently reference data maintained by the Nevada Gaming Control Board when validating house edge figures that feed into expected value calculations. Separate academic work from institutions in Canada has examined how rule differences such as no double after split affect the optimal spread ratios and the resulting correlation strength. These cross-regional comparisons help refine universal models that simulation users apply across multiple jurisdictions.
Practical Applications of Correlation Maps
Developers incorporate correlation findings into training modules that teach players how to adjust spreads dynamically rather than rely on fixed ratios. The maps also guide software updates that automatically scale bets according to real-time penetration estimates derived from ongoing count tracking. Industry groups such as the American Gaming Association have referenced these analytical approaches in broader discussions of responsible gaming tools that incorporate probability modeling.
Conclusion
Mapping exercises continue to supply simulation users with precise coefficients that quantify how reliably true count values predict optimal bet spreads. Updated engines and expanded parameter sets have increased the granularity of these maps while regional rule differences introduce controlled variations that researchers track over time. The resulting datasets support ongoing refinement of both counting systems and betting algorithms deployed in online environments.